Run real systems
xv6 shell 在 virtio-blk board path 上稳定运行;Linux block-rootfs 已推进到 timerfd 边界。
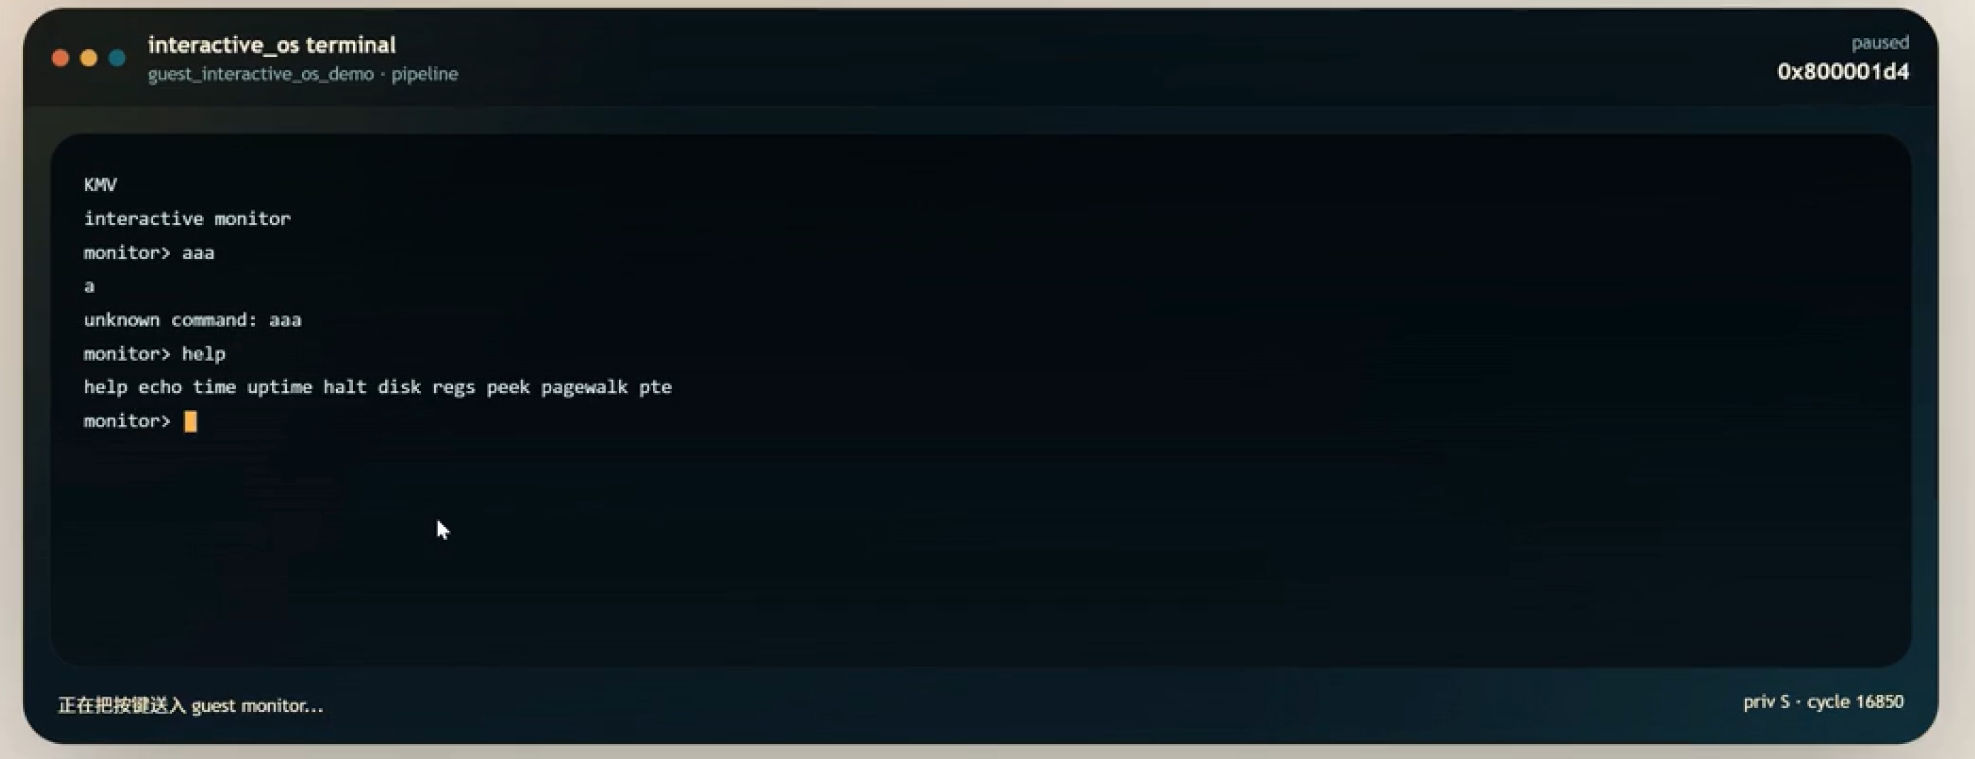
$ guest_interactive_os_demo
KMV
interactive monitor
monitor> help
$ xv6-riscv
init: starting sh
$ linux_proto
stage=timerfd-one-shot-readback-ok
Capabilities
xv6 shell 在 virtio-blk board path 上稳定运行;Linux block-rootfs 已推进到 timerfd 边界。
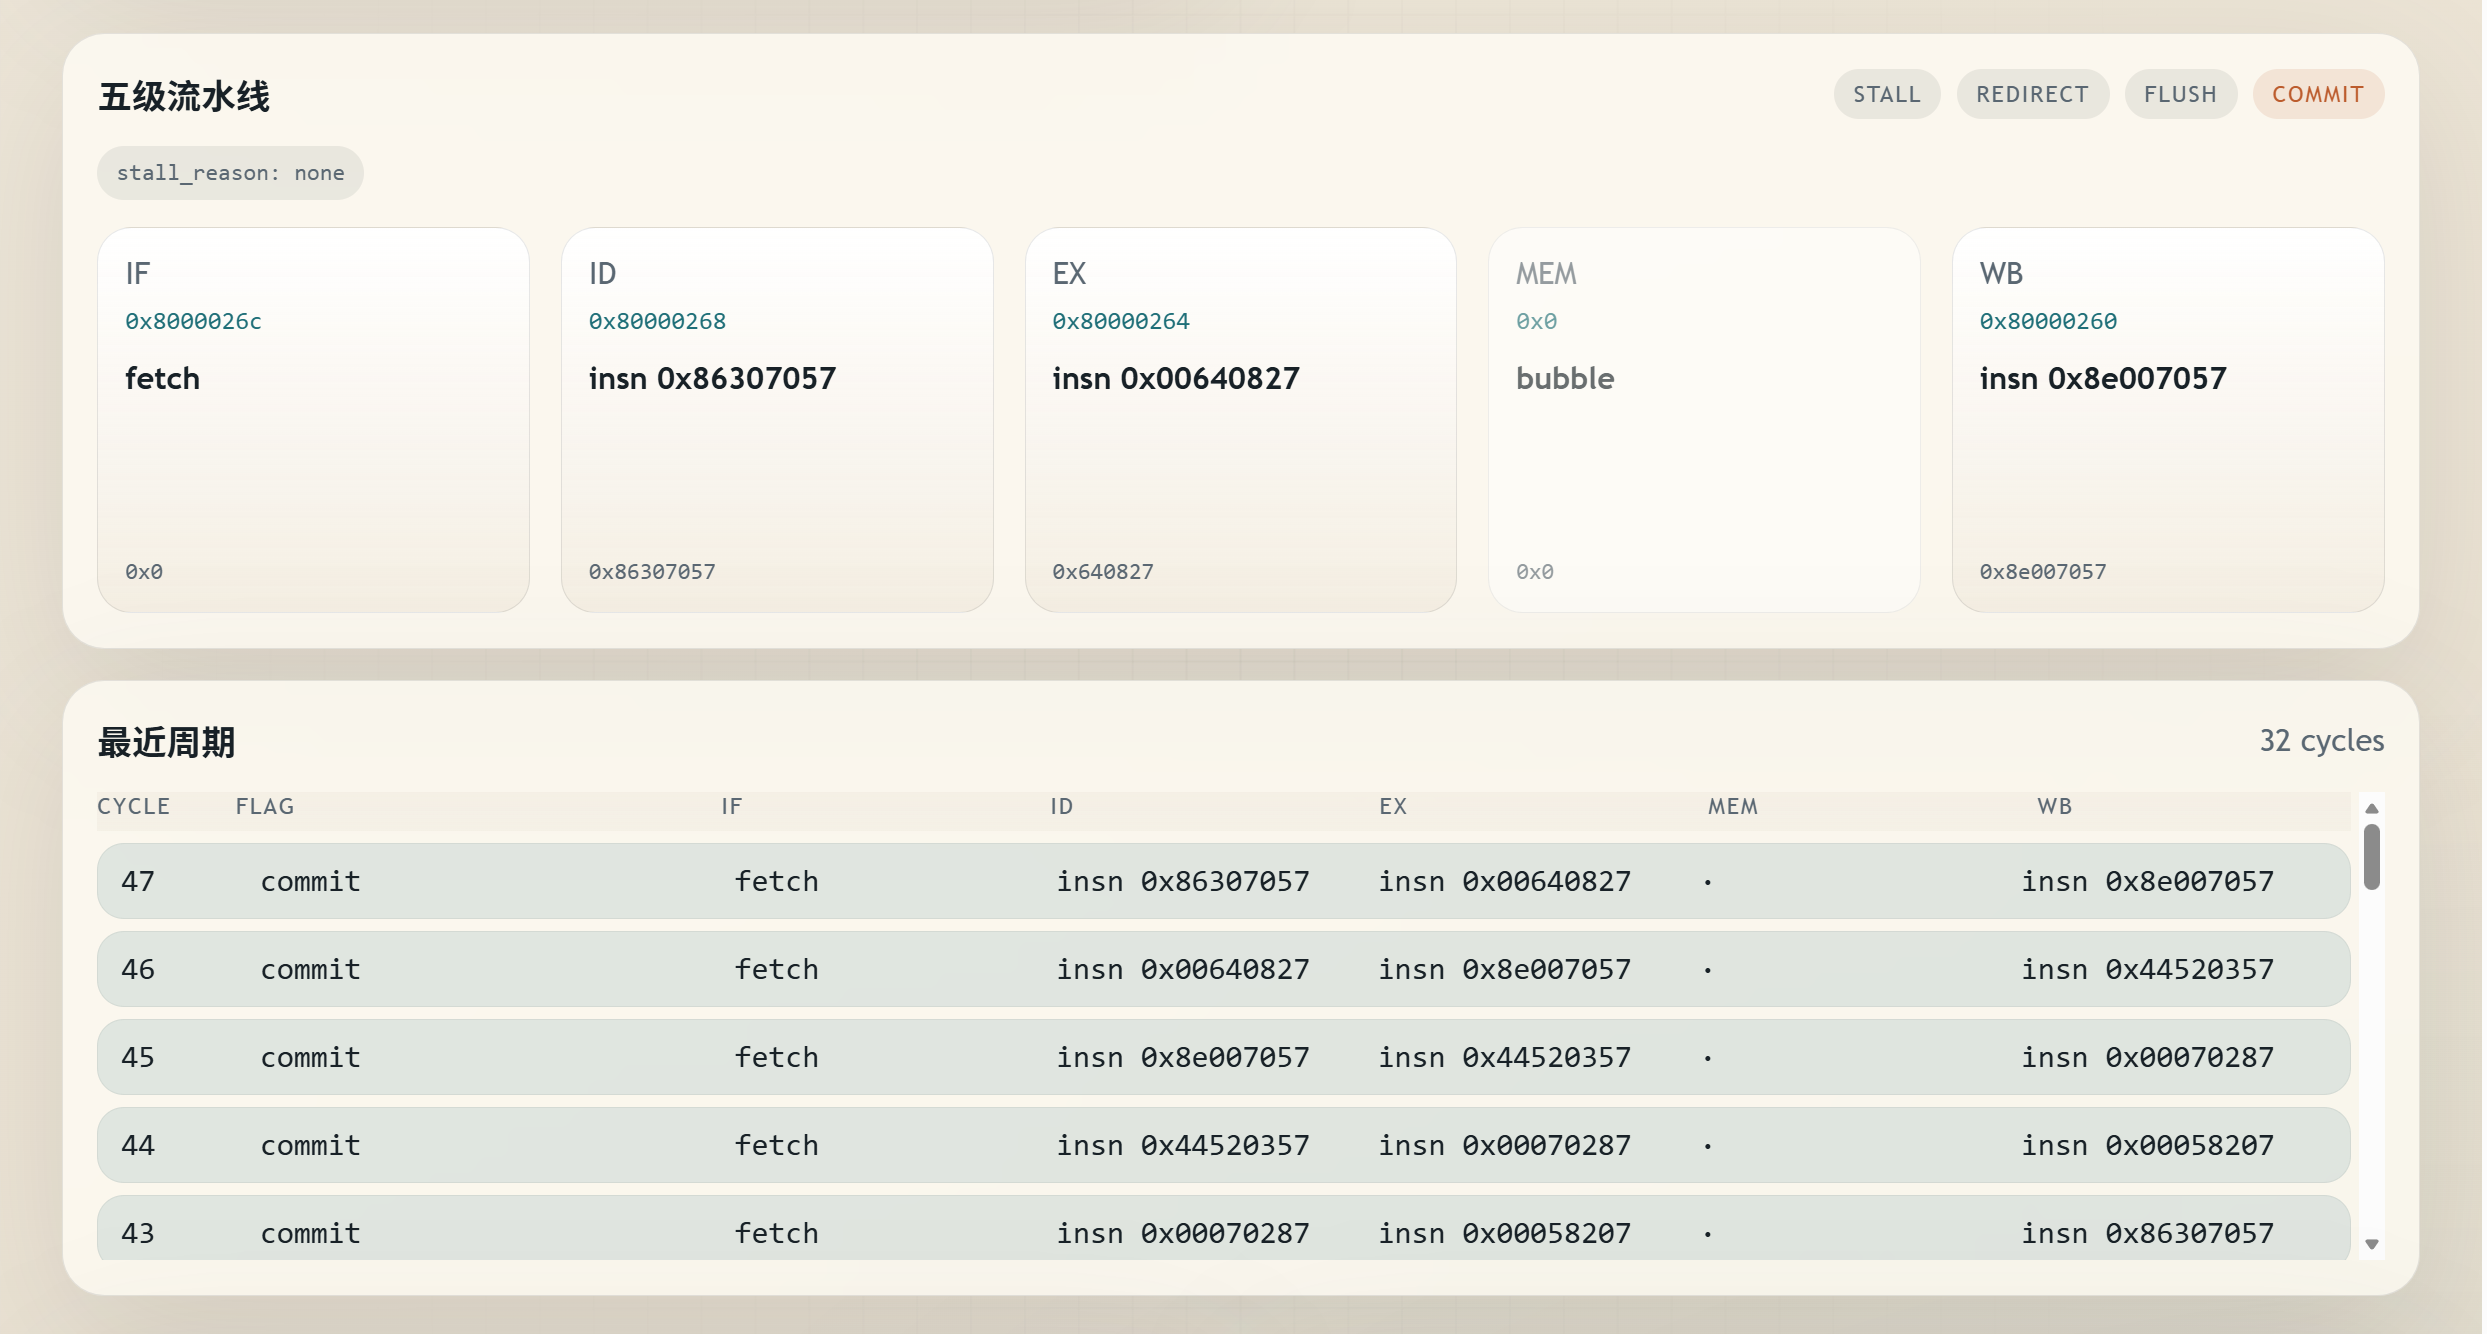
functional 作为 reference 真值来源,pipeline 暴露五级流水线、rename、ROB、LSQ 与寄存器 diff。
AI accelerator 覆盖 graph package、MMIO doorbell、DMA 与 timed-simple profile;Vector CNN 展示 conv-relu 路径。
JIT / DBT opt-in 原型展示 translation、host executable、cache hit / miss 与 fallback 运行数据。
Sv39、trap、CLINT、PLIC、UART 与 virtio-blk 组成系统 bring-up 所需的最小平台。
Spike oracle、functional replay、commit trace 与 host smoke 让每条展示路径都有回归支撑。
Core architecture
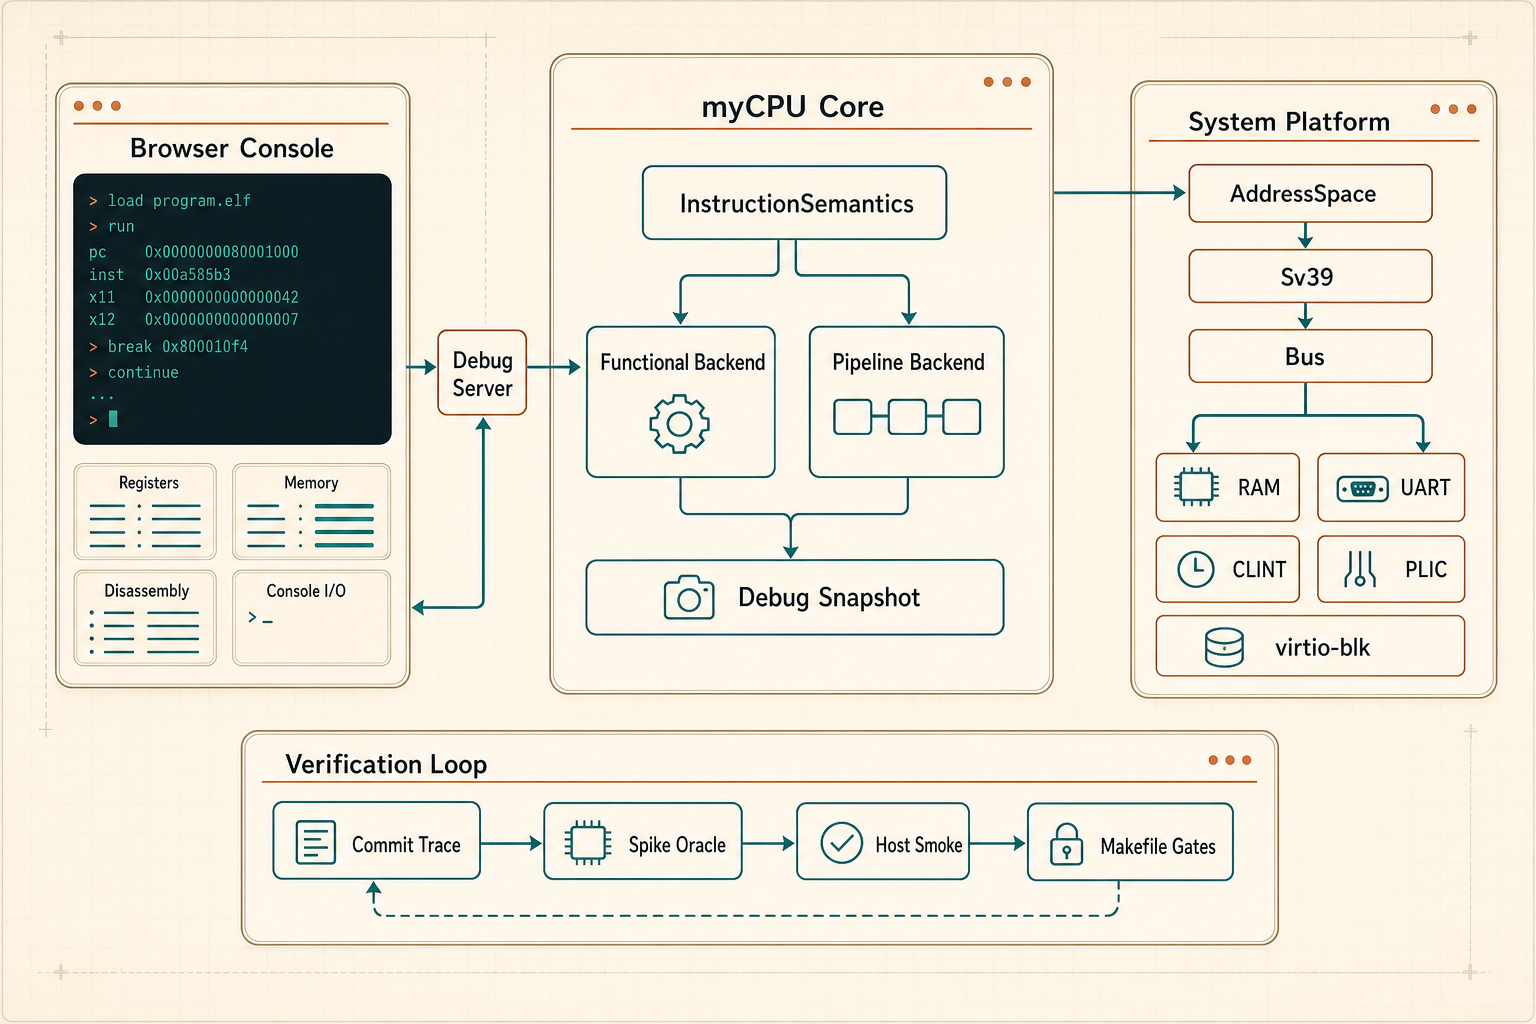
myCPU 不只是终端输出。它把指令语义、地址空间、设备总线、系统 bring-up 和差分验证拆成可组合的基础设施,再通过控制台展示出来。
InstructionSemantics 是共享 ISA 语义入口,functional backend 提供 reference 执行路径,pipeline backend 消费同一套语义并输出 timeline、stall、register diff 和 profile snapshot。
AddressSpace、Sv39 page table、trap runtime、CLINT timer、PLIC interrupt、UART console 和 virtio-blk storage 组成 xv6 / Linux bring-up 的底层路径。
Spike differential、commit trace、host smoke、Makefile gates 和 runtime marker 一起校验 CPU 状态、内存副作用、trap 边界和 workload 输出。
Systems
在真实 virtio-blk 板级路径上稳定运行到 shell,作为 workload guardrail 持续维护。
从 boot log 到 userland marker,Linux bring-up 进度可在浏览器终端中观察。
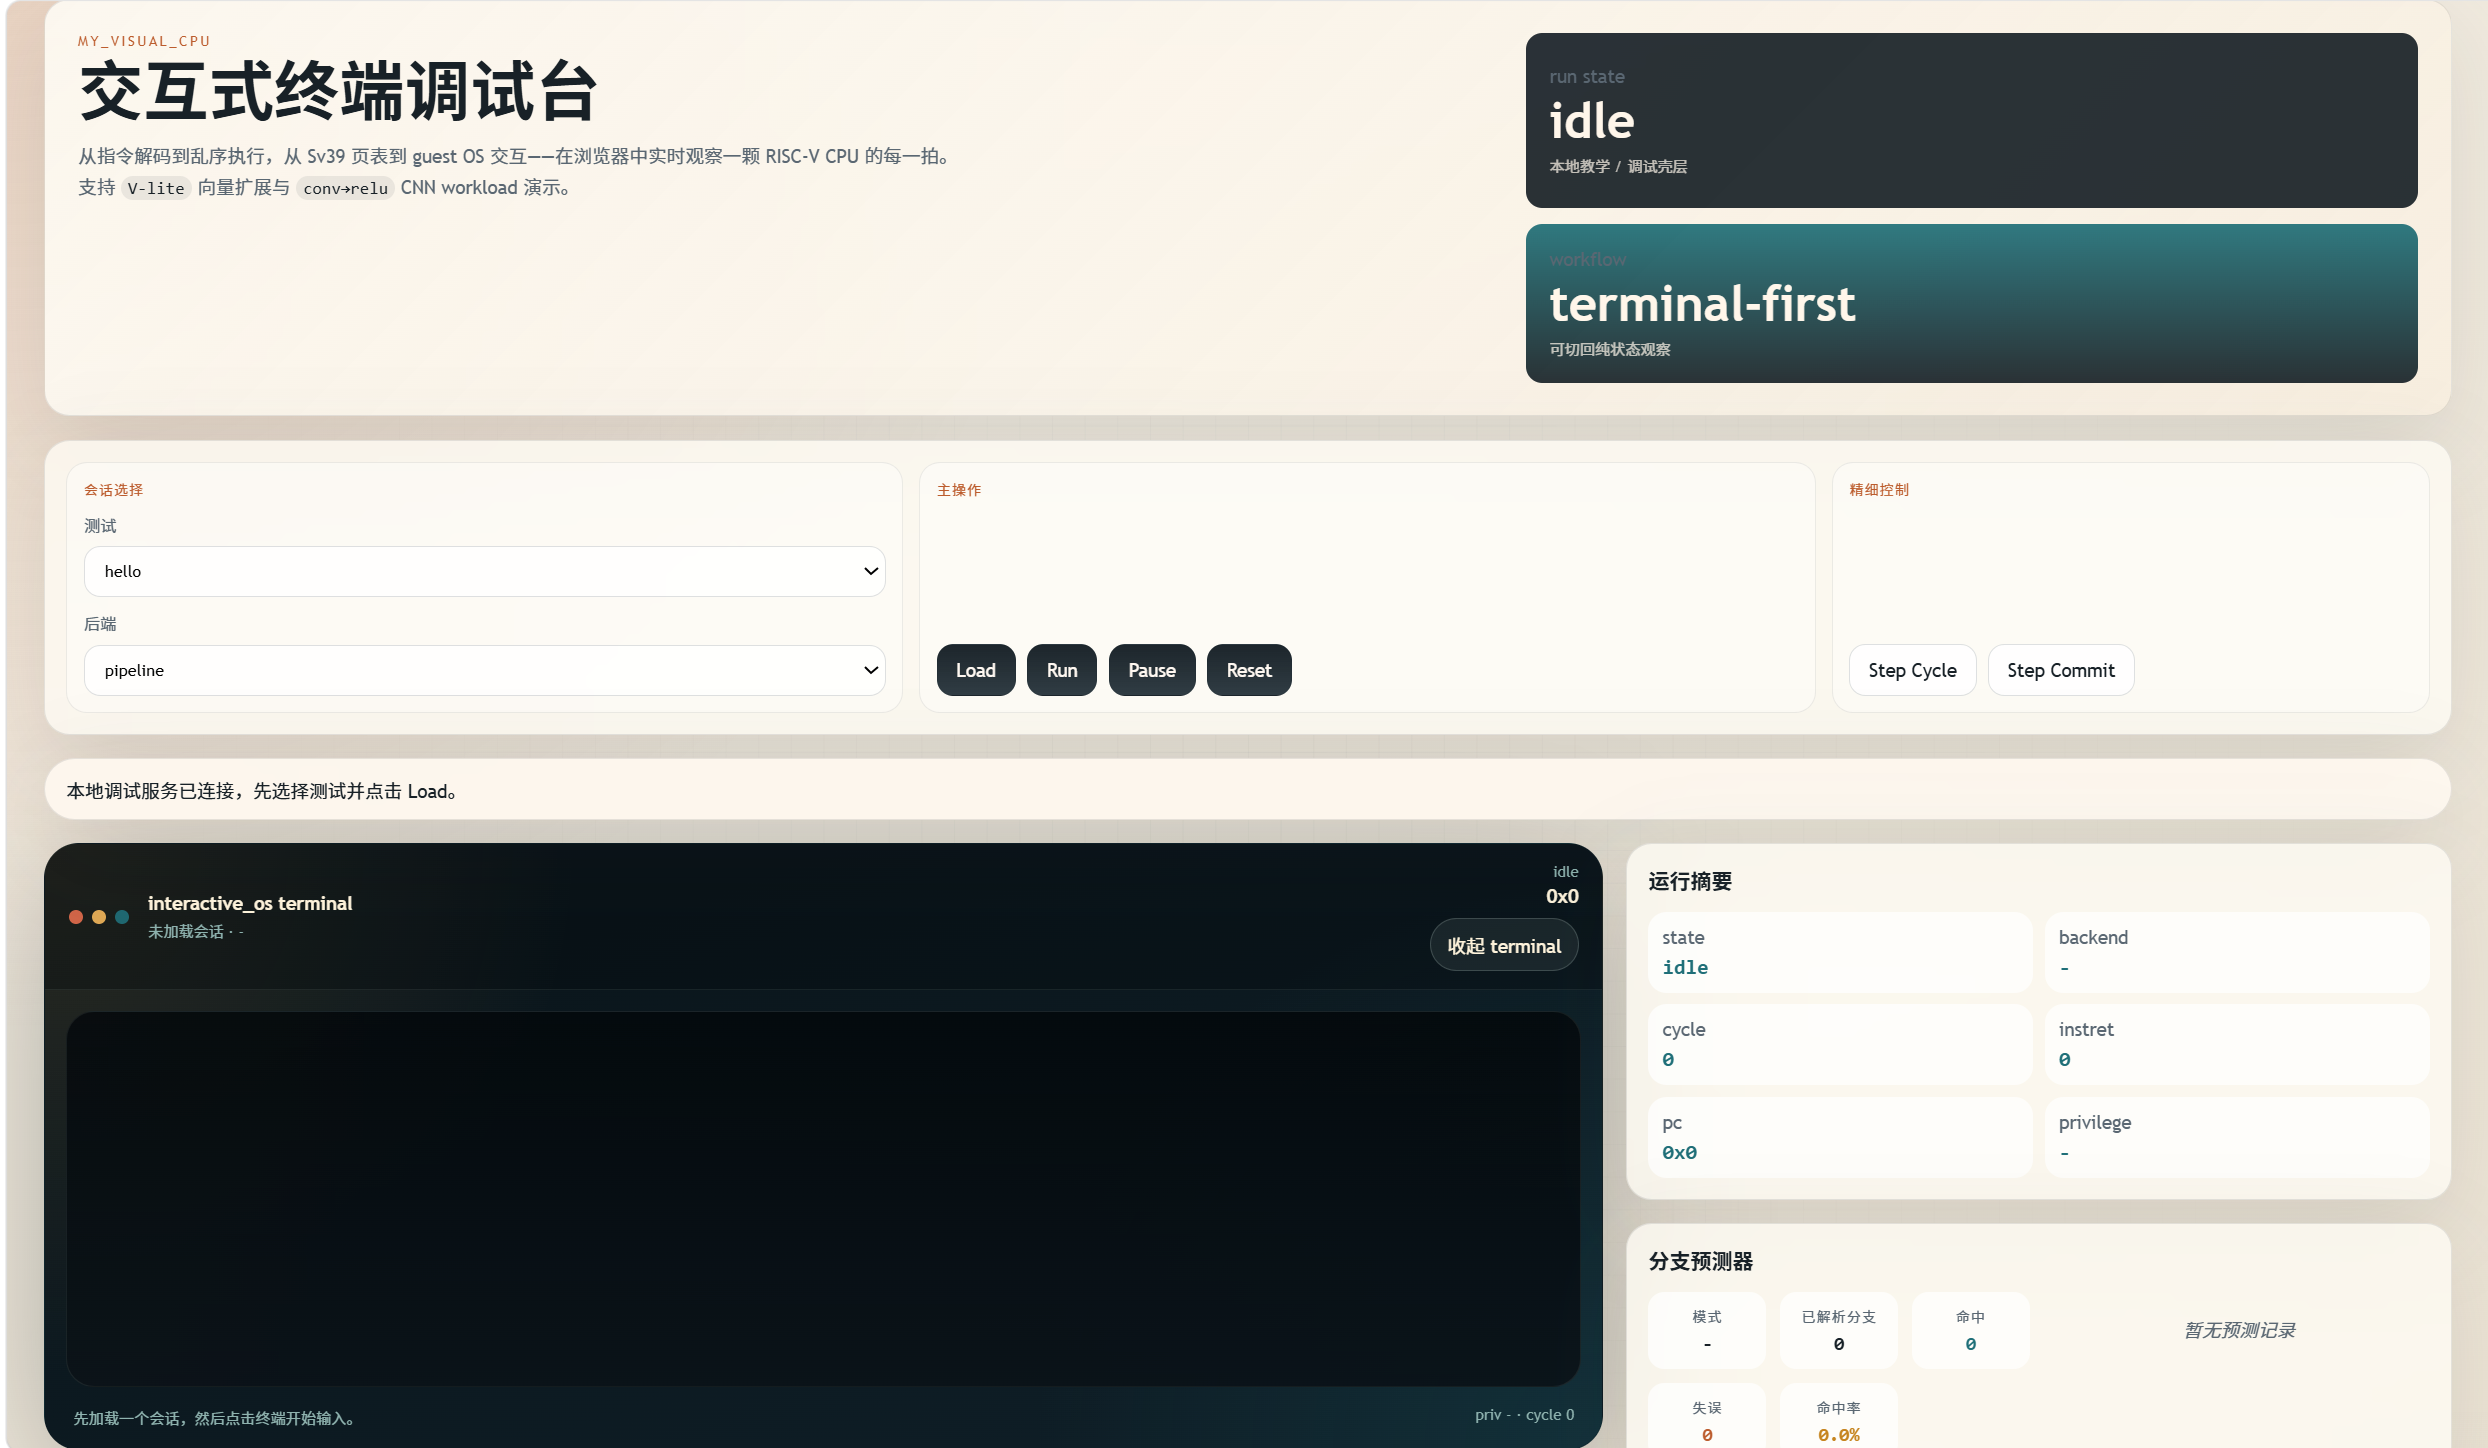
输入 monitor 命令,查看寄存器、磁盘、page walk 与运行状态。
Machine
functional reference 与 pipeline observation 并行,五级流水线、rename、ROB、LSQ、寄存器变化与内存观测尽收眼底。
Accelerator
从预置 workload 到参数化小模型,调整小规模输入,观察 DMA、scratchpad、compute 与 profile counters 的完整数据流。
Labs
translation、cache、profile、fallback 与 memory observation 的运行时数据,全部回到控制台。
IR lowering、host code emission、runtime harness、executable cache hookup 与 invalidation counters。
load / store、shadow cache、L1D counters 与 workload profile 在同一组观察面中呈现。
标准 Debian / Alpine / RISC-V 发行版镜像级平台,以及用户自定义 AI 任务与商用 NPU-like 性能模型。
Verification
覆盖 debug server、真实 debug CLI e2e、terminal、render 与 UI state。
覆盖 supervisor runtime、storage、PLIC、timer 与 boot path 组合。
functional / pipeline 支撑系统运行、机器观察与 profile 展示。
Spike differential、host smoke 与 Makefile 门禁共同支撑页面里的 marker。
Start
打开控制台,启动 interactive_os、xv6、Linux 或 AI demo。在终端、pipeline、profile 与 counters 之间切换视角。
Get Started